by user | Mar 27, 2025 | News, Uncategorized
When thinking about digital advertising, most marketers think first of Google Ads or Meta Ads. However, there is a platform that has been quietly gaining ground and offers very valuable opportunities: Microsoft Ads. This...

by user | Dec 9, 2024 | Uncategorized
The connection between Meta Ads (formerly Facebook Ads) and Looker Studio (formerly Google Data Studio) allows you to create visual and customizable reports that combine data from your ad campaigns with key metrics from other platforms. This integration not only saves...

by user | Nov 26, 2024 | Uncategorized
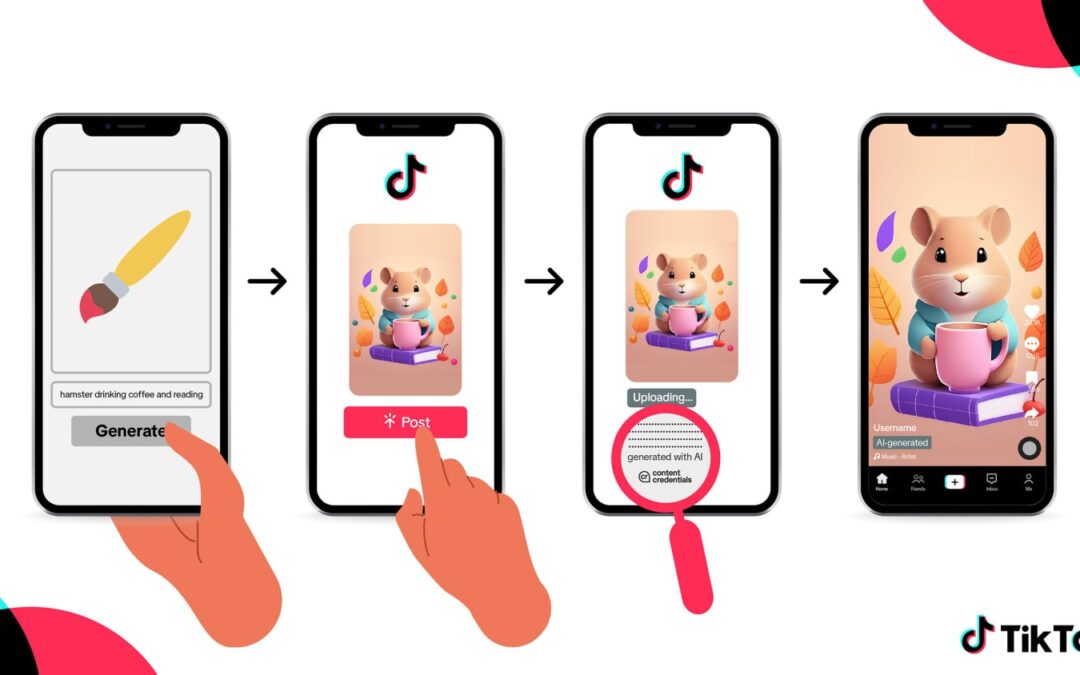
Innovation is the hallmark of TikTok, and its latest venture is no exception. The platform has introduced a new tool powered by artificial intelligence that promises to facilitate and enhance the creation of video content. With this technology, the...

by user | Nov 26, 2024 | Uncategorized
Artificial intelligence (AI) is not only changing the way we interact with technology, but it is also revolutionizing the business world. One of the most prominent developments in this field is the Google AI Sales Assistant, a tool that...

by user | Nov 26, 2024 | Uncategorized
If you've ever noticed that a URL on your site includes a strange parameter called SRSLTID, you've probably wondered what it means and why it appears. This parameter may seem harmless, but its presence in URLs can have implications for the...

by user | Nov 26, 2024 | Uncategorized
The loading speed of an online store is one of the most important factors to offer a good user experience and optimize SEO. At Tiendanube, having a fast page not only increases the likelihood that users will browse longer, but also increases the...


Recent comments